Why Single-Indicator Trading Fails in Crypto Markets
Experienced equity traders who move into crypto are often surprised by how quickly their proven indicators fail them. A clean RSI oversold reading on a well-established stock carries decades of mean-reverting history. In crypto, the same reading can precede another 40% drop because sentiment collapsed, a major holder moved coins to an exchange, and market structure shifted to a bear regime simultaneously. The RSI captures none of that.
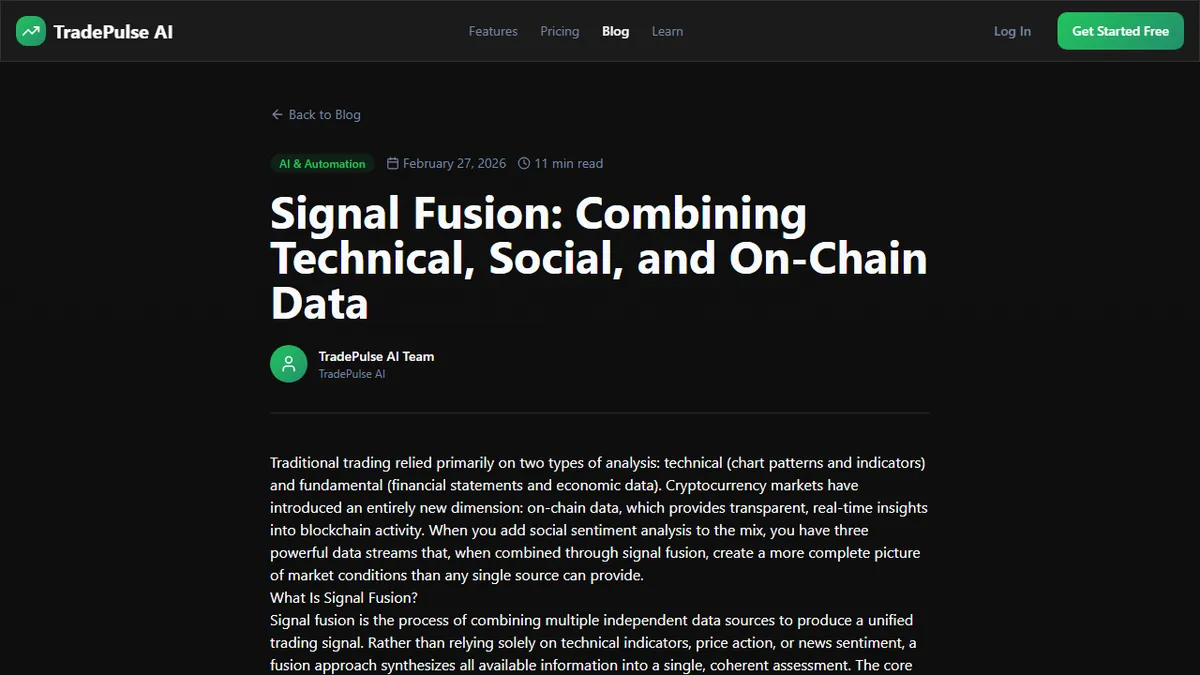
Technical indicators retain genuine informational value in crypto. They are simply insufficient on their own. Price action is shaped by at least four distinct forces: technical momentum, market participant sentiment, derivatives market structure, and large-wallet on-chain behaviour. A signal from any single one of these is blind to the other three. For how multi-source signal fusion works in crypto trading, the core argument is that market reality is multi-dimensional and signal construction must match that complexity.
The Four Inputs: Technical, Sentiment, Market Structure, On-Chain/Whale
Signal fusion draws on four data categories, each measuring a distinct dimension of market conditions.
Technical data (moving averages, RSI, MACD, Bollinger Bands, volume profiles) tells you what price has been doing and at what velocity. It is backward-looking but statistically predictive over short time horizons in stable conditions.
Sentiment data aggregates social volume, engagement rate, and positive-to-negative sentiment ratios across crypto-specific channels. It captures what participants are saying and feeling before that sentiment translates into order flow. Sentiment reversals at extremes have measurable predictive value at inflection points.
Market structure data covers the derivatives environment: funding rates, long/short ratios, open interest, and the liquidation heatmap. It reveals how leveraged the market is, which direction that leverage is concentrated, and where forced liquidations would cascade if price moves against crowded positions.
On-chain and whale data tracks large-wallet activity, exchange inflows and outflows, and network activity metrics. Exchange inflows from whale wallets tend to precede selling pressure. Sustained outflows from exchanges to private storage suggest accumulation. This layer provides the institutional context that retail order flow cannot supply alone.
How the 30/20/25/25 Weighting Was Arrived At
The weighting (technical 30%, sentiment 20%, market structure 25%, on-chain/whale 25%) reflects considered judgment about predictive reliability and market impact, not a purely mathematical derivation.
Technical analysis receives the highest weight because it is the most established, most widely followed, and most directly tied to price action. Enough participants watch the same levels that those levels carry self-fulfilling weight.
Sentiment receives the lowest weight because it is the noisiest input. Social volume can spike from influencer posts, coordinated promotion, or speculative rumour without reflecting genuine conviction. The 20% allocation preserves value at inflection points without allowing noise events to override structural inputs.
Market structure and on-chain data each sit at 25% because both provide high-conviction structural information that resolves over slightly longer time horizons. Funding rate extremes and whale accumulation patterns do not produce single-candle reversals. They create conditions that make reversals probable within a predictable window. These weights are periodically recalibrated against signal performance data.
Conflict Detection: What Happens When Signals Disagree
The most valuable feature in a signal fusion engine is not the signal itself — it is conflict detection. When input categories disagree, the engine must surface that tension rather than averaging toward a neutral midpoint that conceals it.
A concrete example: technical analysis is bullish because RSI is recovering from oversold and price has reclaimed a key moving average. Meanwhile, on-chain data shows a significant exchange inflow from a large wallet in the preceding 24 hours (typically a precursor to selling pressure).
The technical and on-chain inputs are pointing in opposite directions on different time horizons. The conflict detection layer flags this, and the resulting fused signal carries a lower confidence score rather than a false bullish call. The trader sees an explicit acknowledgment of structural caution alongside the technical setup, which is far more useful than a clean directional call with the uncertainty hidden.
Interpreting the Fused Confidence Score in Practice
Every fused signal arrives with a confidence score reflecting the degree of agreement across the four input dimensions.
Above 80%: all four data streams point the same direction with meaningful conviction. Full position sizing is appropriate, assuming the setup also meets your own risk parameters.
Between 55% and 80%: partial agreement, with one or two inputs neutral or mildly contradictory. Act at reduced position size or with tighter stops to account for the residual uncertainty.
Below 55%: the engine is telling you the market picture is genuinely unclear. These are market condition reports, not recommendations. Sitting out when confidence is low is a legitimate and profitable stance.
Signal Fusion vs. AI Consensus: When to Use Each
Signal fusion and AI consensus are complementary rather than interchangeable, and understanding when each applies prevents both duplication and missed value.
Signal fusion operates on structured data: numerical indicator outputs, quantified sentiment scores, measurable on-chain metrics. Use it when you want a comprehensive, data-driven picture of current conditions before entering a position.
AI consensus operates on reasoning: multiple AI models analyse the same information from different analytical frameworks independently. Use it when you want a qualitative sanity check on whether a trade thesis holds up under scrutiny from multiple angles.
The highest-conviction setups are those where a strong fused signal and a high-confidence consensus output agree simultaneously. Data alignment and reasoning alignment in the same direction is a relatively rare combination worth treating seriously.