On this page
A useful comparison needs a trail that another reader can follow: which firms you selected, which record you counted, the dates you used and the calculation you made. Saving two percentages without those details leaves too much to guess.
Here is a small comparison worksheet you can reuse. It is an editorial method for organising research, not a rating system or a recommendation to choose a particular bank.
Choose one measure for both firms
Start by deciding what you want to compare. In this exercise, use outcomes in a defined set of published final Ombudsman decisions. Do not put one firm's internal complaint percentage in the neighbouring column.
The FCA expressly distinguishes firm-reported complaints from complaints referred to the Ombudsman and says the datasets should not be compared directly. FCA explanation
Use Bank Conduct Index's comparison page as a place to begin, then check its published method. Record the precise legal firm names shown, rather than assuming that a familiar banking brand identifies one company.
Freeze the comparison settings
Write down these settings before copying either firm's result:
| Setting | Your research note |
|---|---|
| Firm identity | Exact displayed firm name and record URL |
| Population | Published final decisions, with the relevant sector recorded |
| Period | Start and end dates, including any uncertainty about date boundaries |
| Outcome definition | What counts in the numerator and denominator |
| Coverage | Missing, unclassified or excluded records identified by the source |
| Observation | Date you retrieved the figures |
The index's method describes a banking, credit and mortgages headline scope and distinguishes outcomes recorded from the Ombudsman's classification from its separate identification of partial upholds. Read those details before choosing a calculation; do not invent a treatment for partial or missing outcomes. Index methodology
Recalculate a small example
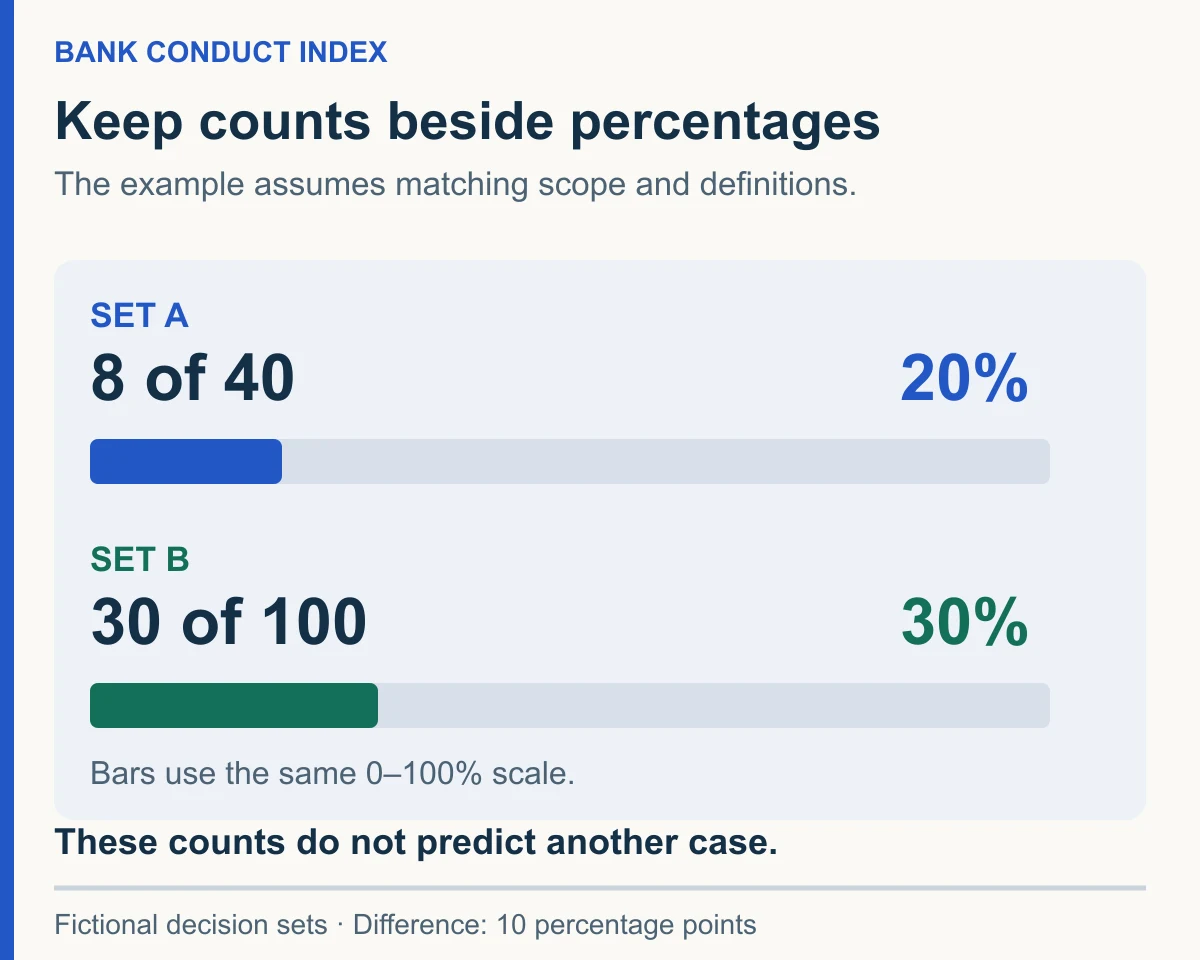
The following figures are entirely fictional. Assume the two sets already have the same documented scope and outcome definition.
| Fictional set | Decisions in the denominator | Upheld decisions | Calculation | Result |
|---|---|---|---|---|
| A | 40 | 8 | 8 ÷ 40 × 100 | 20% |
| B | 100 | 30 | 30 ÷ 100 × 100 | 30% |
The difference is 10 percentage points. This table describes those two invented sets. It does not establish why their outcomes differ, how either firm handles all complaints, or what would happen in another case.
For real figures, retain the counts alongside the percentages. If the page only supplies a rounded percentage, record that limitation instead of reverse-engineering an exact numerator.
Make the result recoverable
Save the source URLs, the date of access and your completed worksheet. If a source offers an export, keep the original export separately from your calculations.
When you revisit the comparison, make a new dated observation. A changed total should prompt a check of the source and filters before it becomes a claim about a firm's performance. Your finished comparison should make it possible to reproduce the arithmetic and see what the arithmetic cannot answer.