Why Benchmark Scores Don't Mean What You Think
When a model provider announces that their latest release achieved 92.3 on MMLU or topped the HumanEval leaderboard, the implied message is straightforward: this model is smarter. The reality is considerably messier. Benchmark scores measure something, but what they measure is often narrower, more gameable, and less relevant to actual work than the marketing copy suggests.
The core problem is that benchmarks are static tests with known answers, and the teams training large language models are fully aware of those answers. A model trained on data that overlaps heavily with a benchmark's test set will score well not because it reasons better but because it has seen the questions before. This phenomenon, known as data contamination, is pervasive and imperfectly disclosed. A handful of providers publish contamination analyses alongside their scores; most do not.
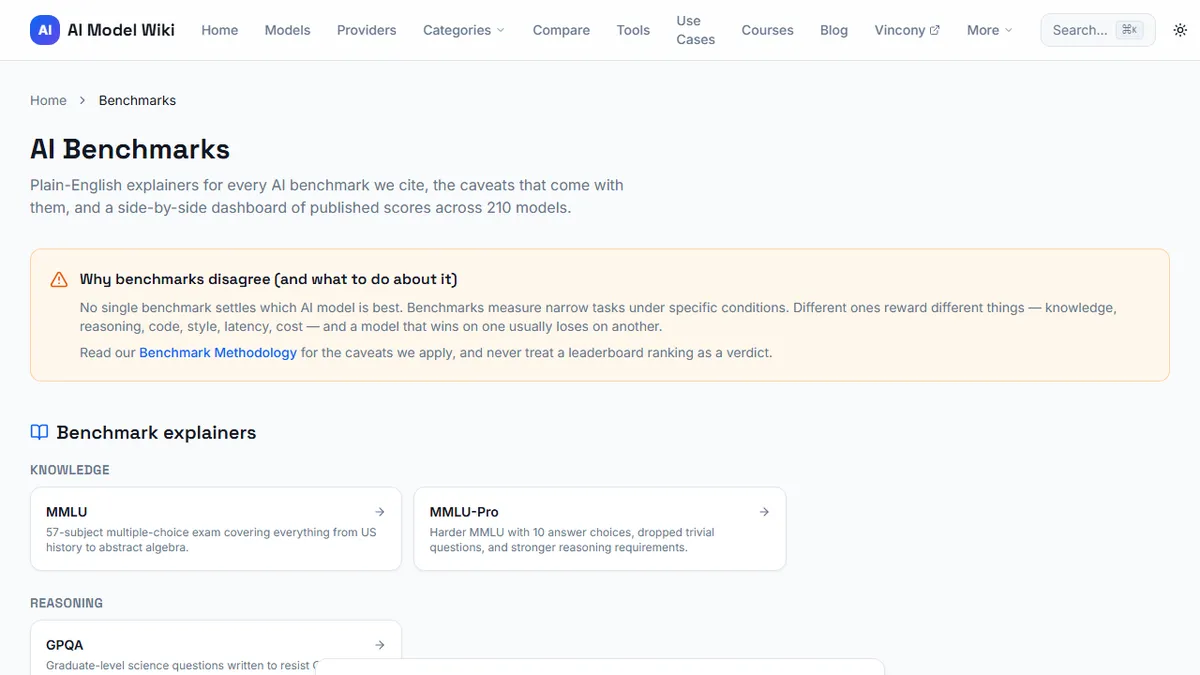
There is also a selection bias that operates upstream of contamination. Providers run models against many benchmarks and report the ones where performance is strongest. Reading a model card that lists four metrics without explaining the ten that were omitted requires a certain professional scepticism that most readers have not developed. The benchmark leaderboards and explainers that aggregate results across providers help expose these gaps, because discrepancies between what one provider reports and what independent evaluators find are often conspicuous.
The Big Six: MMLU, HumanEval, SWE-bench, GPQA, MATH-500, Chatbot Arena
Understanding what each major benchmark actually tests is the prerequisite for reading any score sensibly.
MMLU (Massive Multitask Language Understanding) covers 57 subject domains from school-level sciences to professional law and medicine, using multiple-choice questions. It is broad but shallow. The format rewards pattern-matching over genuine reasoning, and perfect performance is theoretically possible through memorisation alone.
HumanEval presents coding problems that the model must solve by writing function implementations, then tests the output against unit tests. It measures narrow Python coding ability on clean, self-contained problems. Real codebases are rarely clean or self-contained, which is why HumanEval scores correlate only loosely with developer satisfaction.
SWE-bench, particularly its Verified variant, is considerably more demanding: models must resolve actual GitHub issues in real software repositories. Because the problems require reading existing code, understanding context, and writing changes that pass existing test suites, it maps more faithfully onto real engineering work.
GPQA (Graduate-Level Google-Proof Q&A) uses questions that experts in physics, chemistry, and biology struggle to answer from memory. It is harder to contaminate and rewards genuine reasoning over retrieval. MATH-500 samples competition mathematics problems and measures step-by-step reasoning rather than recall. Chatbot Arena uses a crowdsourced Elo rating system based on blind human preference votes, the only metric here that directly measures whether a human preferred one model's output to another.
Red Flags: Signs a Model Card Is Cherry-Picking
Certain patterns in model announcements reliably indicate selective reporting. First, a model card that reports only scores where the model ranks first should raise immediate suspicion. Comprehensive evaluations produce some wins and some losses; an entirely clean record is a curation artefact.
Second, watch for non-standard evaluation settings: custom prompting strategies, atypical sampling temperatures, or evaluation on a subset of benchmark questions rather than the full set. These details are often disclosed in footnotes small enough to be safely ignored.
Third, comparisons that pit the newest model against older versions of competitors (rather than the competitors' latest releases) are a classic technique for manufacturing apparent leadership. Dates matter. A comparison that was accurate in February may be misleading by June.
How to Cross-Reference Benchmarks Like a Researcher
No single benchmark captures a model's overall quality. The researchers who track these systems seriously triangulate across multiple dimensions, weighting benchmarks by their resistance to contamination, their task diversity, and their relevance to the work they care about.
A practical approach is to identify two or three benchmarks that correspond closely to your actual use case, then look for models that score consistently well across all of them rather than exceptionally on one. Consistency across diverse benchmarks is harder to fake than a single standout score.
Independent evaluation organisations (academic labs, third-party leaderboards, and publication-level reviews) provide a check on provider-reported figures. Where those independent figures diverge from official claims, the divergence itself is informative. The complete guide to interpreting benchmark scores walks through this cross-referencing process step by step.
Latency and Cost Benchmarks — The Numbers Vendors Hide
Quality benchmarks dominate the conversation, but for most production applications the relevant performance axes are latency (how fast does the model respond?) and cost (how much does each response cost?). These figures are rarely foregrounded in model announcements because they do not flatter the premium frontier models the way capability scores do.
Tokens per second and time-to-first-token are the two latency metrics worth tracking. For interactive applications, time-to-first-token dominates the user experience; a model that produces 2,000 tokens per second but takes four seconds to start is slower-feeling than one that begins immediately. For batch processing, throughput matters more.
Cost per million output tokens varies by an order of magnitude or more between frontier models and their smaller counterparts. A model scoring 5 points lower on MMLU but costing 90% less per token is often the better business decision for high-volume use cases — a trade-off that vendor benchmark tables are not designed to surface.
Building Your Own Mini-Benchmark for Your Specific Use Case
The most reliable benchmark for your work is one you design yourself. This does not require academic rigour; it requires a few hours and a willingness to document the results.
Collect twenty to thirty representative tasks from your actual workflow — the kinds of prompts you send to a model most frequently and the outputs you judge to be good or poor. Run each candidate model against the same tasks with identical prompts and record the results without knowing in advance which model produced which output. Score the outputs on a simple three-point scale. Calculate the average. Repeat the test after each model update.
This approach has two advantages over published benchmarks. First, it is directly relevant to your work rather than to a standardised task distribution that may not resemble your inputs. Second, it is yours — no provider can optimise against it because they do not know it exists. The overhead is low and the signal is high. For anyone making a decision that involves real money or real users, thirty minutes spent building a task set is thirty minutes that will pay returns for as long as you rely on AI tools.