When two sources show different breach figures, preserve both observations before calculating a difference. First establish what each number counts and whether the documents concern the same incident and scope.
This is a suggested research-log method. The examples below use invented records and make no allegation about a real organisation.
Start with identity and units
Breach Census provides organisation and incident records, with source links described on its about page. Begin with those references, then inspect the underlying documents.
Our suggested log has one row per observation:
| Field | Question to answer |
|---|---|
| Organisation and incident | Which precise record is this about? |
| Original source | Who issued it, and where is the document? |
| Source date and checked date | When was it issued, and when did you read it? |
| Figure and unit | Records, people, notices or another stated measure? |
| Scope | Which population, system, period or jurisdiction does it cover? |
| Qualification | Exact count, estimate, minimum or unknown? |
| Relationship | Does the document explicitly correct or update an earlier one? |
Keep unknown values visible. A blank number should not become zero, and a “records” figure should not be relabelled as a count of distinct people without supporting evidence.
Compare two fictional observations
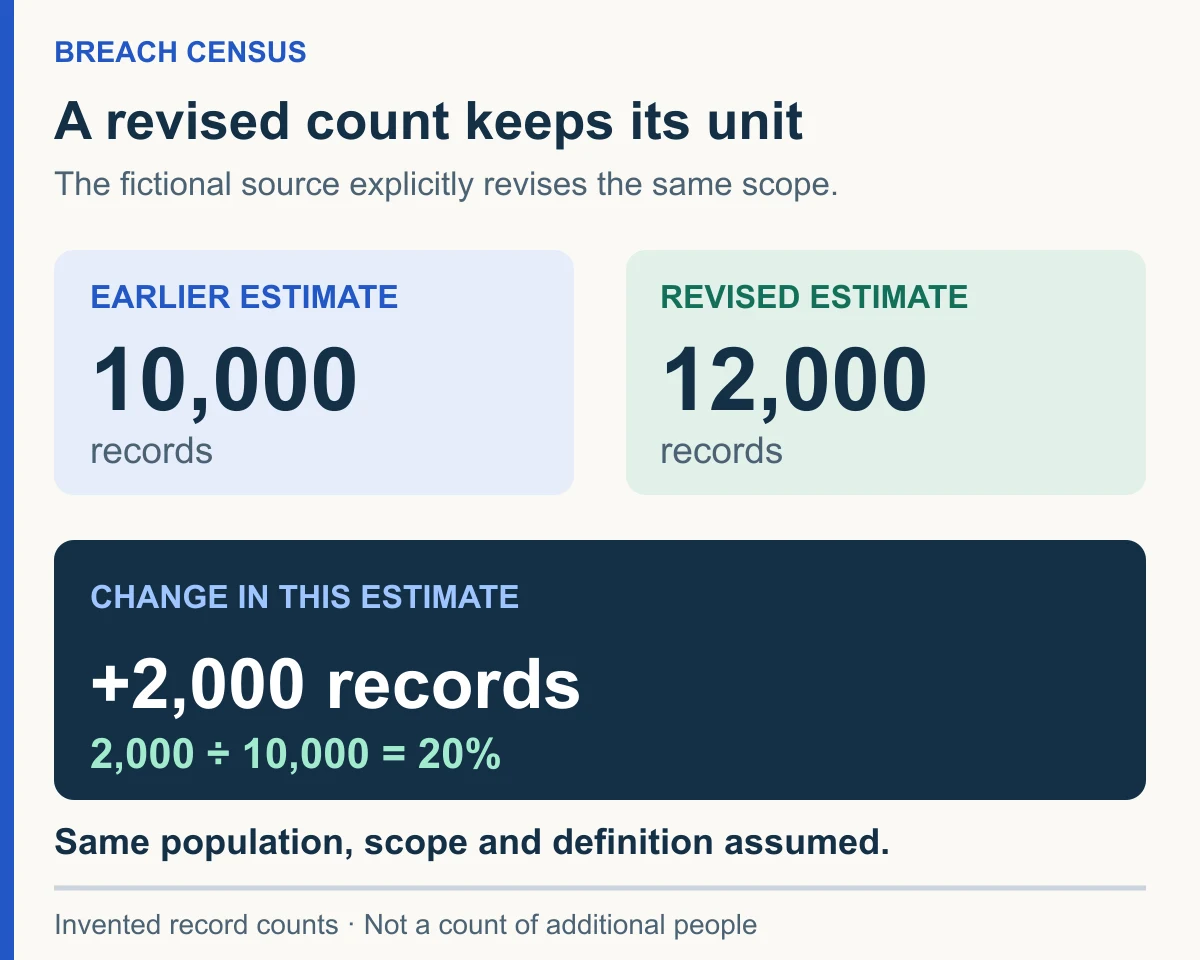
Imagine a first notice reports an estimated 10,000 affected records. A later notice explicitly describes itself as a revision of that estimate and gives 12,000 affected records for the same stated incident and population.
| Observation | Reported figure | Relationship stated in this example |
|---|---|---|
| First notice | Estimated 10,000 records | Initial estimate |
| Revised notice | Estimated 12,000 records | Explicit revision of the same estimate |
The difference between the reported estimates is 12,000 − 10,000 = 2,000 records. Relative to the earlier estimate, that is 2,000 ÷ 10,000 × 100 = 20%.
Those calculations describe the change in the stated estimate. They do not establish 2,000 additional distinct people, a second incident or a reason for the revision.
Now change one assumption: the later figure covers only one region, while the first covers several. The subtraction is still possible arithmetically, but it no longer represents the revision described above. Leave the relationship unresolved rather than placing unlike totals on a growth chart.
Add observations without erasing earlier ones
Retain the original row and add the later notice below it. Link to the passage explaining the update and distinguish its explanation from your own interpretation. If you have no explanation, say so.
Avoid adding repeated entries together merely because they appear on separate pages. Establish whether they describe separate incidents or repeat the same reported count. A revised total also needs checking before it is added to the total it revises.
Before sharing the log, read each calculated change aloud with its unit and qualification: “The reported estimate of affected records increased by 2,000 in this fictional revision.” If that wording is more precise than your chart title, change the chart title.