The referral moment is not the end of your choices
When a GP says they are referring you to a hospital, the conversation usually moves on too quickly. The referral is not a single destination. In England, if you are being referred for a first outpatient appointment, you often have a legal right to choose which provider you are referred to, and that choice can include many NHS trusts and some independent providers. The question is how to make that choice on evidence rather than on the reputation of the nearest building.
A hospital's real record is scattered across several official datasets, and none of them tells the whole story on its own. The waiting-time figure you hear about is only one layer. Below it sit inspection ratings, infection counts, mortality ratios, cancellation numbers, patient experience surveys and even the size of the maintenance backlog. Learning to read those layers takes about ten minutes once you know where each number comes from and what it can and cannot tell you. Start with the full directory of hospital profiles and treat every figure you see there as a clue rather than a verdict.
Trust-wide numbers hide the building
The first trap is the word "hospital". Most NHS performance data in England is published per trust, not per building. A trust can run two, five or ten hospitals, and the waiting times, infection counts, mortality ratio and cancer figures will be identical for every hospital under that trust. The site labels these "Trust-wide" for a reason. If you are choosing between two sites run by the same trust, those numbers will not help you.
What is genuinely per-building? CQC inspection ratings are assigned to a hospital location. Estates data such as parking charges, the cost of a patient meal, single en-suite rooms and the maintenance backlog are per site. Cleanliness and environment scores from patient assessors are per site. So a fair reading of a hospital separates the trust-level clinical record from the building-level reality. A trust can have excellent surgical outcomes and a tired, cramped outpatient department. Both facts matter, but they answer different questions.
Waiting times: read past the headline
The referral-to-treatment waiting time is the number most people check first, and it deserves a closer read than the headline. Each trust publishes waiting-list data by treatment specialty. The constitutional standard in England is that 92% of incomplete pathways should wait no longer than 18 weeks from referral. That single percentage can look similar across two trusts while hiding very different distributions.
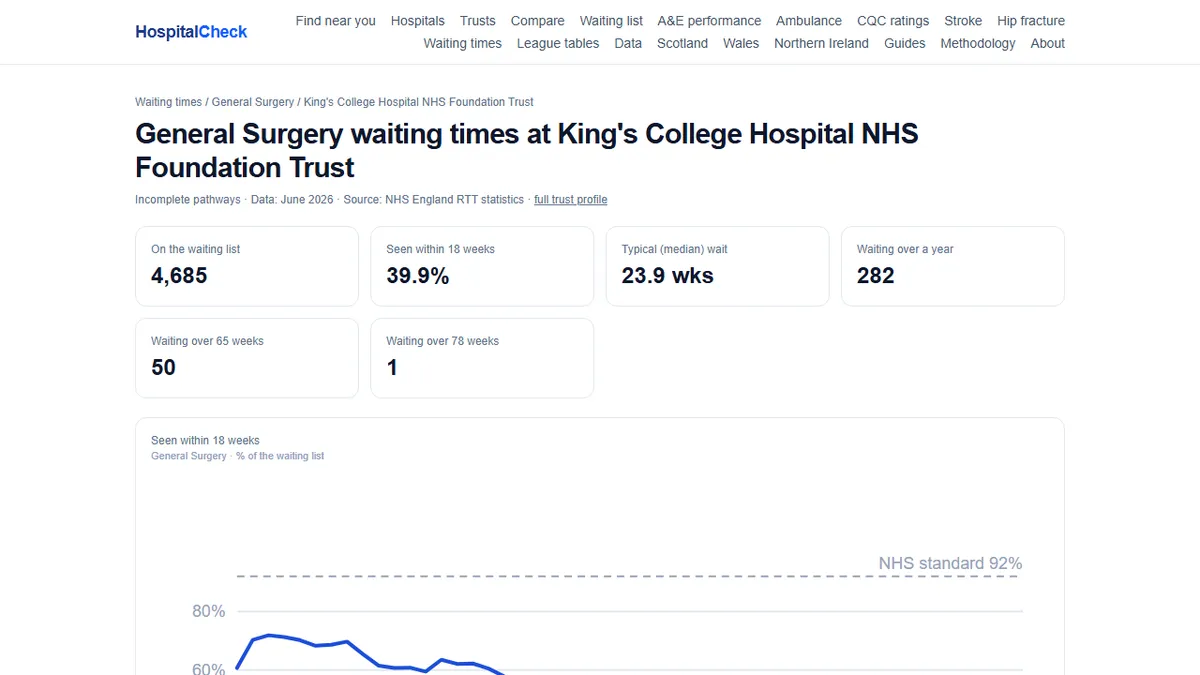
Look at the median wait, which tells you the typical patient's experience, and at the number of people waiting over 52 weeks, which tells you how badly the tail end is stretched. A trust can meet the 92% standard and still have a long tail of patients waiting more than a year, because the standard is about the majority, not everyone. If your referral is for a specific specialty, find that specialty's page rather than the trust's overall number. For example, general surgery waiting times at King's College Hospital will tell you more about your likely wait than the trust-wide figure alone.
CQC ratings: what a good rating doesn't tell you
The Care Quality Commission inspects hospitals and rates them on five questions: safe, effective, caring, responsive and well-led, plus an overall rating. Those ratings are the closest thing the system has to a single quality badge, and they are published per hospital location, which makes them more useful than trust-level figures for choosing between buildings.
But a CQC rating is a snapshot, not a guarantee. Inspections happen periodically, and a hospital can be rated Good overall while a specific service is under pressure. Read the five key questions separately. A hospital can have a Good overall rating and a Requires improvement rating for responsiveness, which is the dimension most likely to affect how long you wait and how smoothly your appointment runs. The rating also tells you little about the patient mix. A hospital that cares for a sicker, older or more complex population can record worse outcomes despite providing excellent care. Use the rating as a filter, not a final answer.
SHMI and infections: use them as prompts, not verdicts
The Summary Hospital-level Mortality Indicator (SHMI) is the ratio of observed deaths to expected deaths at a trust, banded into higher than expected, as expected, or lower than expected. It is a screening tool, not a death rate. A "higher than expected" band means the trust's mortality pattern deserves investigation; it does not prove that patients were poorly cared for. Conversely, a "lower than expected" band is reassuring but not a guarantee of safety. The same logic applies to infection counts. MRSA, MSSA, E. coli, Klebsiella, Pseudomonas and C. difficile figures are published per trust, split into total and hospital-onset subsets. A large trust will record more infections than a small trust simply because it has more patients and more bed-days. The count is not adjusted for size. When you look at these numbers, compare trusts of similar activity and focus on the hospital-onset subset, which is the part most plausibly connected to the care you would receive.
The patient-experience numbers and the cancelled-operation count
The Friends and Family Test asks patients whether they would recommend a trust's care. It is voluntary and self-selected, so the response rate matters. A trust with a high recommendation score and a very low response rate is not telling you the same story as one with a similar score and a much higher response rate. The test has no official pass mark and is not a substitute for clinical measures. Treat it as a temperature reading, not a thermometer.
Cancelled elective operations are reported quarterly per trust. The figure counts last-minute cancellations for non-clinical reasons and how many of those patients were not treated within the 28-day standard. It is a raw count, not adjusted for how many operations the trust performs. A busy trust that does a high volume of surgery may cancel more operations in absolute terms than a smaller trust while having a lower cancellation rate. Again, context is everything. Never Events are rarer and more serious — wholly preventable incidents such as wrong-site surgery. They are reported per trust as raw counts and should never be used to rank hospitals. One Never Event is one too many, but a trust with a single recorded event is not necessarily less safe than a trust with none, because reporting culture and case mix vary.
Build your own shortlist
Before you accept a referral, you can assemble a practical picture without much effort. The specialty waiting time tells you more than the trust's overall figure, and if your referral is for suspected cancer, the 28-day and 62-day cancer standards are the ones to read. The CQC rating should be checked for the exact hospital building you would attend, with the five key questions read separately from the overall badge. The trust-wide mortality band and the hospital-onset infection counts are worth noting as prompts for investigation, not verdicts. The Friends and Family Test is only meaningful when you know its response rate, and cancelled operations only make sense in the context of how many operations the trust performs. Remember that the most recent month of many datasets is provisional and gets revised later, so don't treat a single month as gospel. Finally, if you are weighing two trusts against each other, put them side by side. A direct comparison will often reveal that one trust is better on the dimension you care about and worse on another. Use the side-by-side trust comparison tool to keep the numbers honest.
