Start with the postcode, not the brochure
The estate agent's description of a property is a piece of marketing. It tells you the number of bedrooms, the size of the garden, and how close the school is when the wind is blowing in the right direction. It will not tell you that the road floods in January, that the nearest bus stop has a service that stops at 6pm, or that the last sale on the street went through for a figure the agent would never quote.
You can find all of that out before you offer, using the same official datasets the professionals use. The trick is knowing which datasets matter, how to read them, and where the gaps are.
My Area UK is a free utility that pulls these datasets into one place. For any postcode or town it will show you recent crime, house prices, flood risk, food hygiene ratings, transport stops, deprivation figures and more. It is not a substitute for visiting the street at 8am and 8pm, but it will stop you falling in love with a postcode before you have checked the basics.
Sold prices: what the guide price doesn't tell you
The asking price is not a fact. It is a hope. The only real numbers are the ones registered with HM Land Registry when a sale completes, and they are public.
My Area UK's house-price panel uses Land Registry Price Paid data, so it shows actual transactions, not agent valuations. Look for the most recent sales on the specific road, not just the town. A house on a busy junction will sell for less than the identical house around the corner, and the Land Registry data will show it.
If you are looking at a new-build development, be even more careful. The first tranche of sales often sets a benchmark, but later phases can be priced higher. The sold prices will tell you what people actually paid, which is not the same as what the developer is asking now.
Street-level crime: look at the month, not the headline
Crime data is published monthly by data.police.uk, and it is street-level. That means you can see incidents on the road you are considering, not just the crime rate for the whole ward.
The important thing is to look at the period. Crime figures are shown for a specific month, and they lag behind. A single spike in one month can look alarming; a quiet month can look deceptively safe. Do not judge a neighbourhood on one month's data. Look at the pattern over several months, and check what categories are involved. Anti-social behaviour is a different problem from burglary, and both have different implications for your daily life.
Also remember that crime data covers England and Wales only. If you are buying in Scotland, the panel will not be there, and you will need to use Police Scotland's own statistics.
Flood risk: the quiet dealbreaker
Flood risk is the thing that estate agents are legally obliged to mention, but they will find ways to make it sound manageable. "The garden has been waterlogged a couple of times" can mean the ground floor needs to be gutted.
My Area UK uses Environment Agency flood-monitoring data for England. That includes live flood warnings and river levels, not just the static risk zones. If the property is near a river or a known flood plain, check the flood panel and then go to the Environment Agency's own flood maps for the detailed risk rating.
The absence of a warning is not the same as the absence of risk. Flood warnings are issued for events that are happening or are forecast. A house that has never flooded can still be in a high-risk zone on paper, and insurance premiums will reflect that. Check the risk before you offer, not after the survey.
Food hygiene: the high street tells you a lot
The Food Standards Agency publishes hygiene ratings for every restaurant, cafe, pub and takeaway in the UK. It is a surprisingly good proxy for how a neighbourhood is doing.
A high street with a row of 5-star cafes and a decent butcher is a different place from a high street where the only food outlets have ratings of 2 or below. The ratings are not a judgment on the people who run those businesses — a low rating can be a paperwork problem rather than a hygiene disaster — but they do tell you something about investment, footfall and local standards.
My Area UK's food-hygiene panel pulls from the FSA database, so you can see the ratings for the places you will actually eat at. If the only places near the house have not been rated, that tells you something about the high street too.
Transport: stops exist, but do the buses run?
A transport panel that shows a bus stop 200 metres away is not the same as a usable bus service. The stop may have one bus a day, or a service that only runs during school term time.
My Area UK lists nearby bus and train stops from OpenStreetMap, and for London it also shows live next-departure times from Transport for London. For the rest of the country, you will need to check the operator's timetable yourself. The stop data tells you where the stops are, not how often the vehicles arrive.
If you commute, do the test run before you offer. Stand at the stop at the time you would actually need it, and see whether the advertised service shows up. The data will tell you the stop exists; only experience will tell you whether it works.
Deprivation: compare like with like
Deprivation indices are published separately for England, Scotland and Wales, and they use different methods. You cannot compare an English Index of Multiple Deprivation score with a Scottish SIMD score, and My Area UK is careful to label which index is being used.
What the index tells you is relative deprivation within a country, not the character of a street. A low score does not mean the pavement is littered; a high score does not mean there is a Waitrose on every corner. It is a statistical summary of income, employment, education, health, crime, housing and access to services. Use it to spot outliers — a pocket of deprivation in an otherwise comfortable area can affect schools, house prices and insurance.
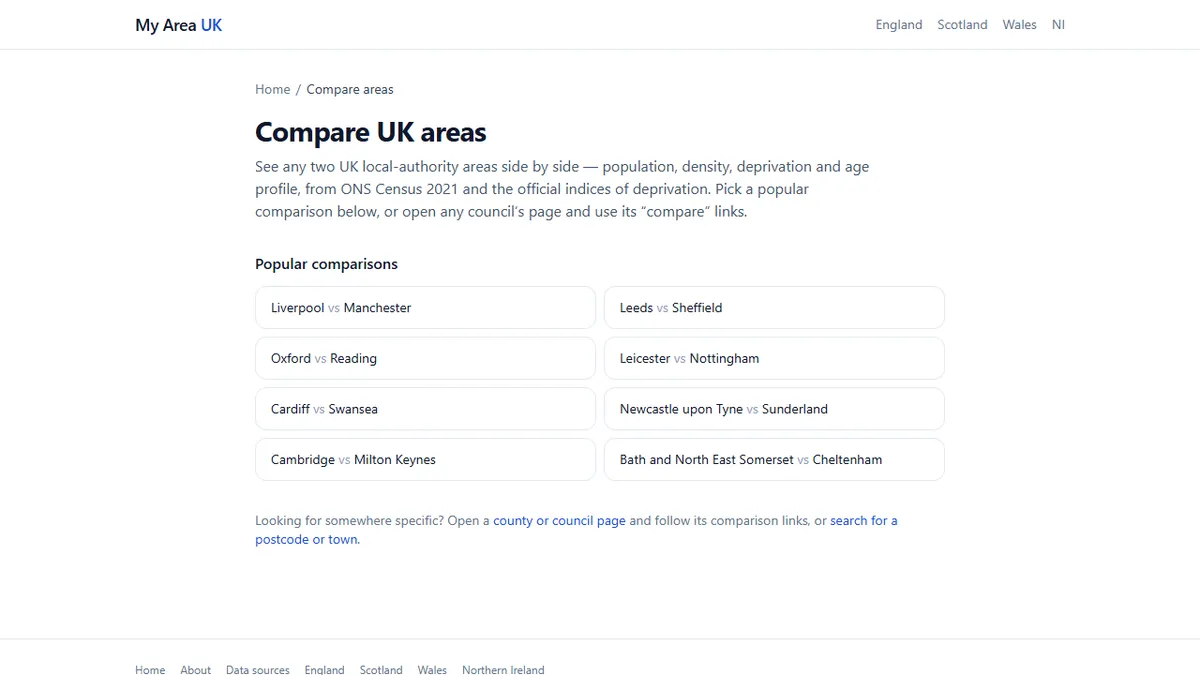
The compare tool lets you put two local authorities side by side, which is useful when you are choosing between two towns or two parts of a city. You can compare crime, house prices, deprivation and other metrics without flicking between tabs. If you are deciding between two local authorities side by side, the compare tool gives you a clearer picture than any agent's brochure.
Make the comparison before you commit
The most expensive mistake in moving home is not paying too much. It is paying the right price for the wrong place. You can change the kitchen, but you cannot change the flood risk, the bus route or the crime pattern.
Before you make an offer, pull up the area profile for Ashley and work through the panels methodically. Check the sold prices, the crime month, the flood warnings, the food hygiene ratings, the transport stops and the deprivation score. Then go and stand on the street at the times that matter to you.
If you are moving to a new region, check the local authority hub as well. For example, the East Suffolk council hub will show you what the council is publishing, including local announcements and any area-specific data. It is not the same as knowing the town, but it is a better starting point than a three-bedroom description and a drone video.
The data will not make the decision for you. But it will make sure the decision is based on what is actually there, rather than what someone wants you to believe is there.