Why a Single Number Beats Scrolling Through Thousands of Tweets
Every day, tens of thousands of posts, threads, and comments appear across social platforms discussing Bitcoin, Ethereum, and hundreds of smaller tokens. Attempting to read that volume manually (even for a single asset) would occupy every waking hour and still leave you with nothing but a pile of contradictory impressions.
A mood score solves this by collapsing the noise into a single number on a zero-to-one-hundred scale. Rather than asking you to intuit the overall tone of a thousand posts, it surfaces a calibrated reading you can check in seconds and carry forward into a decision. The power is not in the specific digit but in the systematic consistency: the same methodology applied to every asset, every hour, makes comparisons meaningful in a way that manual scrolling never could be.
This matters more than it sounds. Crypto markets operate around the clock across global time zones. By the time most retail traders wake up, the overnight social conversation has already shifted. Positions have been taken, narratives have evolved, and some assets have quietly accumulated attention that has not yet moved their price. A glanceable mood score gives you that overnight reading before you open a chart.
The Three Pillars: Sentiment, Velocity, and Social Volume
The mood score is a composite, not a single raw measurement. It draws on three distinct inputs, each capturing something the others miss.
The first is sentiment: a measure of the bullish or bearish tone across social posts mentioning an asset. Sentiment analysis assigns polarity to language: excited, optimistic commentary pushes the reading positive; worried, critical, or dismissive language pushes it negative. Sentiment on its own tells you the emotional temperature of the conversation at a given moment.
The second input is social velocity: the ratio of current mention volume to the recent historical baseline. An asset that normally receives 800 mentions per day is behaving very differently if it suddenly receives 3,200, even if the raw count is small compared to Bitcoin's daily volume. Velocity captures whether attention is accelerating, not just how much attention exists in absolute terms.
The third is social volume momentum: the sustained trend in mention counts over a rolling window rather than just the instantaneous spike. A sudden single-day burst registers differently from a steady climb across seven consecutive days. Momentum distinguishes lasting interest from transient noise.
When these three inputs are combined and weighted, the result is a composite that reflects both the quality and the quantity of social engagement, smoothed to reduce single-event distortion.
How Scores Are Weighted and Normalised (0–100 Scale)
Raw data from social monitoring systems arrives in incompatible units: sentiment might range from minus one to plus one, while mention counts span from dozens to millions depending on the asset's size. Before these inputs can be combined, they must be normalised to a common scale.
Normalisation involves mapping each raw value against its historical distribution for that asset and expressing the result as a percentile or scaled fraction. An asset with an unusually high mention count for its own history scores higher on the volume component than an asset with the same absolute count but a much larger baseline.
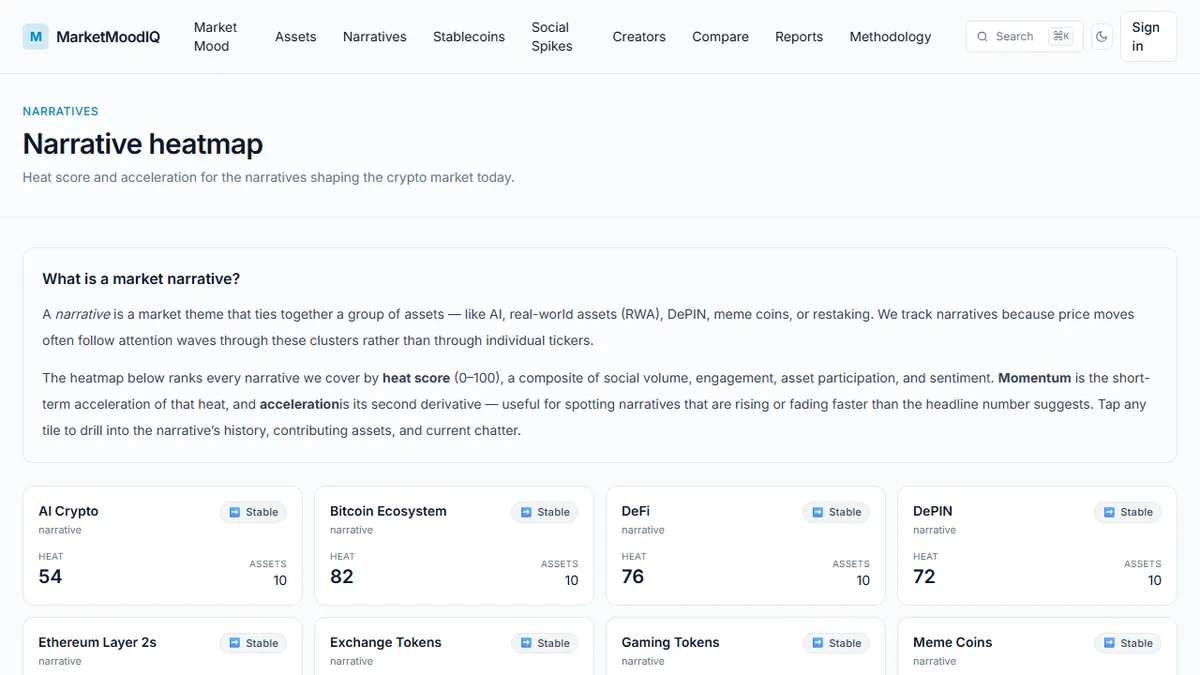
The three normalised components are then weighted and summed to produce a value on the zero-to-one-hundred scale. Exact weighting ratios vary by platform (the full derivation is explained in the resource covering how mood scores are derived and normalised), but the general principle is that sentiment contributes the largest share, followed by velocity, with volume momentum playing a moderating role. This weighting reflects the reality that tone matters more than noise.
Reading Mood at a Glance: What 30, 60, and 85 Actually Mean
The zero-to-one-hundred scale is designed to be intuitive once you understand the rough zones it implies. A score in the low thirties indicates an asset experiencing predominantly negative social commentary, low relative social attention, or both. This does not necessarily mean the price is falling — it means the crowd is cautious, critical, or simply disengaged.
A score around sixty sits in the broadly constructive range. Social posts lean positive, mention volume is at or modestly above baseline, and there is no sign of the kind of euphoric acceleration that historically precedes sharp corrections. For many assets, a score in the mid-fifties to mid-sixties is their typical operating range during healthy, unremarkable periods.
A score of eighty-five or above signals something more unusual: strongly positive sentiment, elevated social velocity, and sustained attention momentum occurring simultaneously. This kind of reading often accompanies a meaningful price run or a major piece of news. It is worth paying attention to — but with the awareness that very high scores can also appear at local tops, when the maximum number of people have already become enthusiastic.
Common Misreadings: When a High Mood Score Can Still Mislead
The most frequent misreading is treating a high mood score as a direct instruction to buy. The score measures social atmosphere, not price trajectory. Markets are full of instances where overwhelming optimism arrived at precisely the wrong moment — after a sustained run, when early participants were already selling into the excitement of late-arriving retail buyers.
A related trap is comparing mood scores across assets of very different sizes or asset classes without accounting for the normalisation context. An 80 for a large-cap token and an 80 for a small-cap token emerge from very different underlying distributions. The small-cap score may have been generated by a narrow community of a few hundred active accounts, making it far more susceptible to manipulation or rapid reversal.
Finally, a single-day reading tells you far less than a trend. An asset moving from 40 to 65 over a week tells a different story from one that has been stuck at 65 for three weeks and just registered a slight daily dip. Direction and rate of change matter as much as the instantaneous value.
Putting It to Work: A Practical Morning Checklist
Incorporating mood scores into a daily research habit does not require an elaborate process. A brief morning check covering four or five of your most-watched assets can surface meaningful information in under ten minutes.
Start by noting each asset's current score alongside its score from the previous two days. You are looking for directional change, not just the current number. An asset trending from 55 to 62 to 70 over three consecutive mornings warrants more attention than one sitting statically at 72.
Next, flag any score that sits in an extreme zone (below 30 or above 80) and ask what is driving it. Extreme readings are often connected to specific news events, partnership announcements, or coordinated social campaigns that the score itself does not explain. The score flags the anomaly; your judgement interprets the cause.
Finally, compare mood against price movement for the same period. Agreement (rising mood alongside rising price) confirms a narrative. Divergence (rising mood with flat or falling price, or vice versa) is a signal worth examining more carefully before drawing conclusions.