On this page
Before using a percentage, find the definition of its numerator, denominator, service and reporting period. A hospital name beside a number does not establish that it describes your building, appointment or stage of care.
HospitalCheck's metric-source list distinguishes referral-to-treatment data, diagnostic waits and other measures. Its descriptions are useful navigation; follow the named official source when interpreting a figure.
Identify the waiting population
The ONS explanation of UK planned-care statistics, published in June 2024, distinguishes open pathways from completed ones. It also explains that a person may have more than one pathway, so pathway counts are not necessarily counts of distinct people.
Retain that distinction in your notes. “Still waiting at the period end” is a different population from “completed treatment during the period.” Do not label one as the other.
Do not separate diagnosis from treatment too neatly
The NHS guide to waiting times in England says the waiting period can include tests and scans. A diagnostic wait may therefore sit within a referral-to-treatment pathway; it is not automatically a separate earlier period to add or exclude.
That does not make a diagnostic statistic interchangeable with an RTT statistic. Ask which stage and definition the published measure actually covers. This article does not calculate an individual's waiting clock or determine whether an exception applies.
Check a fictional percentage
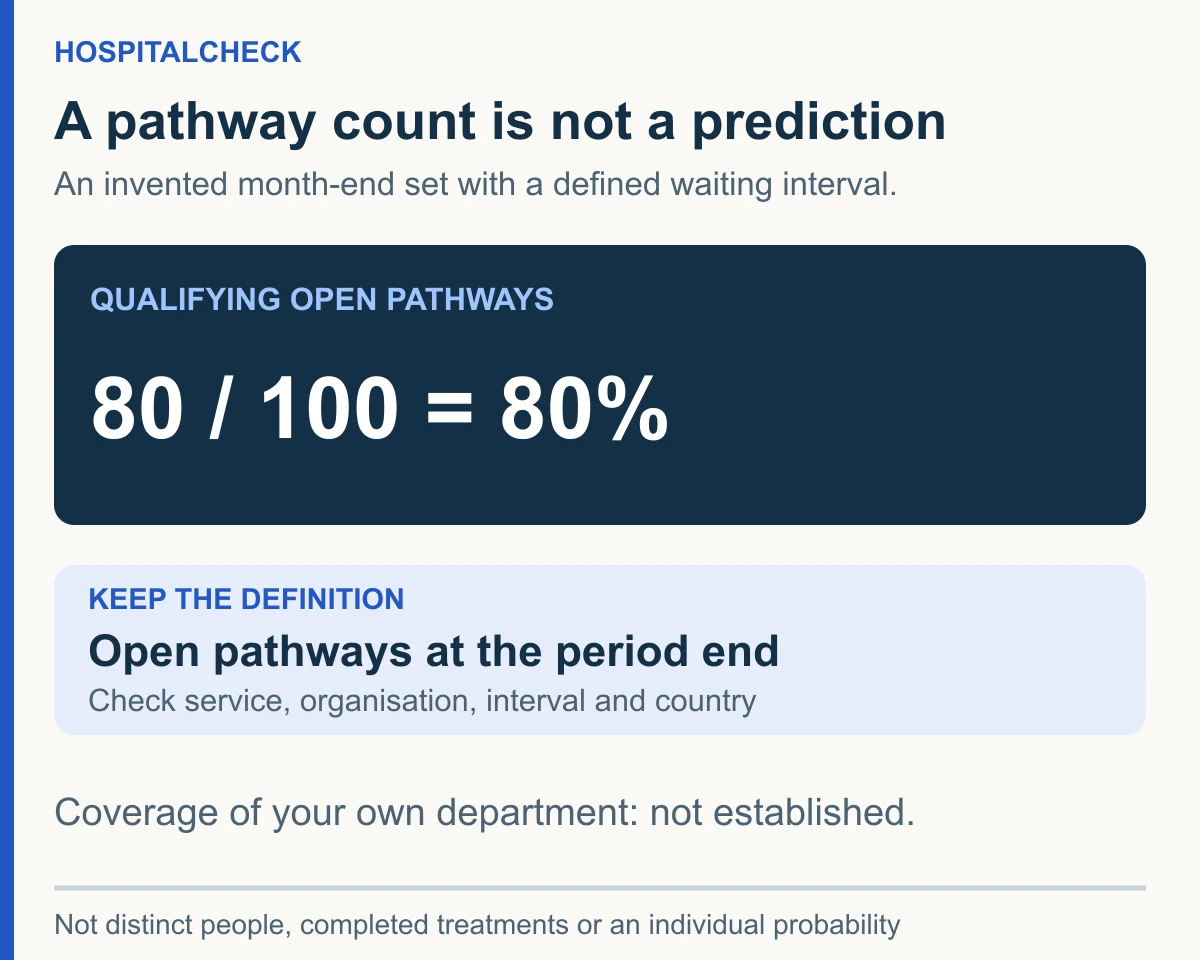
Suppose a fictional table says “80 of 100 open pathways are within a stated interval at month end.” That gives 80% for those defined pathways.
| Proposed interpretation | Supported by the example? |
|---|---|
| 80% of the defined open pathways fall within the stated interval | Yes, under the exercise's assumptions |
| 80 distinct patients have completed treatment | No: neither distinct people nor completion was supplied |
| I have an 80% chance of treatment by a particular date | No: no individual prediction was supplied |
| The figure covers my exact hospital department | Unknown until the organisation and service scope are checked |
Keep coverage gaps visible
Record the country, organisation, specialty, population, interval and publication date. ONS warns that headline waiting statistics across the UK are not directly comparable because their coverage differs. Do not use a shared word such as “waiting” to erase those differences.
The finished note should state what the measure covers and which personal question still belongs with the care team.