What 'audio-reactive' actually means
Most music visualizers are decorative. They play a looping animation alongside a track, or pulse a few bars in a loosely timed pattern, but the connection between what you hear and what you see is superficial. An audio-reactive visualizer is fundamentally different: it analyses the audio signal in real time, frame by frame, and drives every visual element directly from that analysis. The graphics are not running alongside the music. They are being computed from it, continuously, at 60 frames per second.
This distinction matters for the listening experience in a way that becomes immediately obvious once you have seen a true audio-reactive system in action. When the kick drum hits, the visual responds to that specific frequency at that specific moment. When the synth swells, the colour field or particle system or waveform representation responds to that change in harmonic content. The visual becomes a translation layer, not a metaphor for music in general but a direct representation of this sound, right now.
The Web Audio API: turning sound into data
The technology that makes browser-based audio reactivity possible is the Web Audio API, a browser-native audio processing system that gives JavaScript code real-time access to the audio being played. Understanding how it works demystifies the whole pipeline.
When a track starts playing in a browser, the Web Audio API can route that audio signal through an AnalyserNode (a processing object that continuously computes the frequency spectrum of the incoming audio). The AnalyserNode performs a Fast Fourier Transform on the audio data, which breaks the continuous sound wave into discrete frequency bands: sub-bass, bass, low-midrange, upper-midrange, presence, and brilliance. Each band gets an amplitude value that updates multiple times per second.
This amplitude data is what the visualizer reads. Every frame, JavaScript queries the AnalyserNode for the current frequency distribution (essentially asking "how loud is the sub-bass right now? How loud is the midrange?") and feeds those values into the rendering system. The kick drum registers primarily as sub-bass energy. A sharp hi-hat registers in the upper frequency bands. A lush synthesiser pad spreads energy across a wide midrange frequency spectrum. The visualizer responds to these different signatures in visually distinct ways.
WebGL and the rendering pipeline
Once the audio data is flowing as a stream of frequency values, something has to draw the visuals. That something is WebGL (a browser API that gives JavaScript direct access to GPU rendering pipelines). Where normal browser rendering uses the CPU to paint HTML and CSS elements, WebGL sends vertex data, texture maps, and shader programs directly to the graphics card for execution.
This matters because real-time visualizations are computationally intensive. A particle system with thousands of elements responding to audio data requires hardware acceleration to run smoothly. A WebGL rendering pipeline can process hundreds of thousands of geometry operations per frame at 60 frames per second because the GPU is purpose-built for exactly this kind of parallel numeric computation.
The practical result for the viewer is silky-smooth visuals that respond without perceptible lag. When the audio frequency data changes, as it does continuously, the GPU recalculates the visual state in under a millisecond. The connection between sound and image feels instantaneous because it effectively is.
How visualizer themes change the emotional read of the same track
One of the more surprising aspects of audio-reactive visualizers is how much the visual style affects the listener's emotional interpretation of identical audio. The same techno track experienced through a minimal, monochromatic waveform theme produces a different feeling from the same track experienced through a particle-explosion theme that saturates the screen with colour on every kick hit.
This is not a trivial observation. Research on multisensory perception shows that visual information modulates the emotional weight listeners assign to sounds. A slow, amorphous bloom of soft colour makes atmospheric music feel more meditative. Sharp, angular geometric responses to a hard kick make the track feel more aggressive and physical. The visual theme functions as an interpretive lens — it does not change what the music is, but it changes what the music means to the person experiencing it.
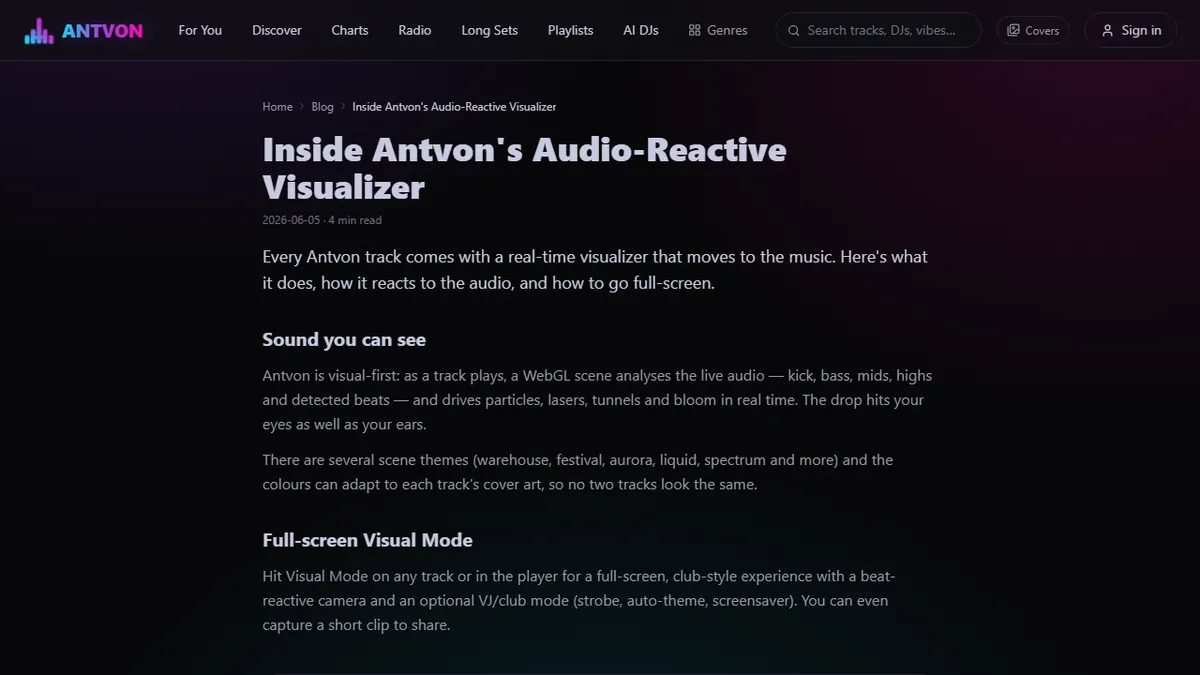
For more on how the real-time audio-reactive visualizer is built from an engineering perspective, the architecture decisions behind theme switching and GPU shader design reward the technically curious.
Five visualizer styles and which genres they suit best
Different visual styles match different genres because the production characteristics of those genres create distinct frequency patterns. A minimal waveform visualizer (one that simply maps amplitude to a line in real time) works exceptionally well for ambient and downtempo music, where the slow movement of the waveform mirrors the unhurried pace of the genre. Every gradual shift in the pad layer becomes visible, which rewards careful attention.
Particle systems, where audio amplitude controls the density, velocity, and colour of thousands of small points, suit trance and melodic techno well. The build-and-release structure of trance produces dramatic visual escalation as the particle count swells during the breakdown and then explodes at the drop. Frequency-spectrum bar displays (the classic equaliser style) are well-suited to techno and house, where the hard kick and defined bass frequencies produce clear, rhythmically obvious visual responses. Three-dimensional waveform tunnels and kaleidoscope geometries suit psychedelic and progressive genres, where the visual complexity matches the layered harmonic density of the audio.
Why visual-audio pairing is the next step for streaming platforms
Standard music streaming platforms offer album art as their only visual accompaniment to playback, a static image chosen by the artist or label that has no relationship to the sonic content moment by moment. Audio-reactive visualizers represent a genuinely different proposition: every frame of the visual is a response to the audio, making the experience more absorbing and the listening more attentive.
This matters commercially because attentive listeners stream more. Passive background music is constantly at risk of being turned off when something else demands attention. Music that actively engages the visual sense as well as the auditory one holds the listener more effectively. For platforms building around AI-generated music (where the audio quality already has to compete with human artists), adding a native visual layer that human artists rarely offer is a meaningful differentiator. The upgrade in the listening session is real, not hypothetical.